
Is It Really an Organoid? A Practical Guide to Phenotype Characterization
Organoids can model aspects of tissue development, disease and drug response, but no single image or marker proves that a culture represents its intended tissue. Characterization should establish what grew, whether it remains consistent with its source or target lineage, and whether it performs the function required by the study.
What phenotype tests does an organoid study need?
A useful plan has three linked layers. They are a practical framework, not universal pass/fail rules; the markers and acceptance criteria must be set for the model and purpose.
| Layer | Core question | Representative evidence |
|---|---|---|
| Culture quality | Is the culture viable, traceable and free of detectable contamination? | Longitudinal images, growth and passage records, recovery, microbial and mycoplasma testing. |
| Identity and architecture | Does it contain the expected cell types in a plausible tissue arrangement? | Histology, spatial immunostaining, lineage markers and, when relevant, comparison with source tissue and genetic identity. |
| Fit-for-purpose function | Can it perform the activity on which the scientific conclusion depends? | Organ-specific physiological assays, treatment response, and orthogonal molecular or imaging readouts. |
1. Establish routine culture quality
Track morphology over time. Capture images at defined time points and scale. Record formation efficiency, number per well, size distributions, lumen or branching features where relevant, growth and changes after passage or thaw. A representative photograph cannot show batch variability or prove that a structure remained stable.
Check contamination and provenance. Keep source, processing, matrix, medium, passage, freeze–thaw and assay records linked to each line. Use an appropriate validated mycoplasma assay; absence of obvious changes under a microscope does not establish a negative result. Set testing frequency and release criteria through the laboratory’s own quality system. Recent gastrointestinal organoid reporting guidance highlights the importance of source, matrix, medium, passage and contamination details for reproducibility.
Measure expansion and recovery. Compare growth across passages and independent preparations, and record recovery after cryopreservation. Avoid applying a single passage ratio, survival percentage or size cutoff to all tissue types: culture behavior differs by source, protocol and endpoint.
2. Verify tissue identity and fidelity
Look beyond shape
H&E sections reveal architecture, lumen formation, atypia and necrosis. Immunohistochemistry or immunofluorescence can map lineage, differentiation, proliferation and polarity markers within the structure. A marker panel should distinguish the intended cell types and compartments rather than rely on a single positive stain. For example, intestinal studies may examine stem or progenitor, absorptive, goblet and enteroendocrine populations; the expected profile differs between small intestine, colon, healthy tissue, tumor tissue and differentiation state.
For patient-derived tumors, compare with the source
Review the original pathology and compare organoid histology, relevant protein markers and selected molecular alterations with the matched specimen when it is available. Short tandem repeat profiling can help authenticate human donor identity and detect a mismatch, while sequencing can assess whether study-relevant variants are retained. These tests answer different questions: a matching identity profile does not by itself demonstrate that tumor histology, subclones or drug response are preserved. Recheck at points dictated by passage history, banking or critical experiments rather than assuming perpetual fidelity.
Use deeper profiling when it resolves a real uncertainty
Bulk or single-cell transcriptomics, spatial profiling, proteomics and flow cytometry can refine cell-state or population analysis. Each change what is observed: dissociation-based methods lose native spatial context, while an image may miss rare cell states. Select the method that answers the biological question and confirm key conclusions with an independent assay when possible.
3. Demonstrate the function relevant to your model
A convincing functional endpoint depends on the tissue and experimental goal. Examples include epithelial barrier or transport measurements, intestinal secretory responses, liver-associated metabolic activity, renal transport, cardiac calcium dynamics or contractility, and neuronal activity. The presence of a lineage marker does not establish that its associated function is mature. Conversely, a functional signal should be interpreted alongside cell composition and structural organization.
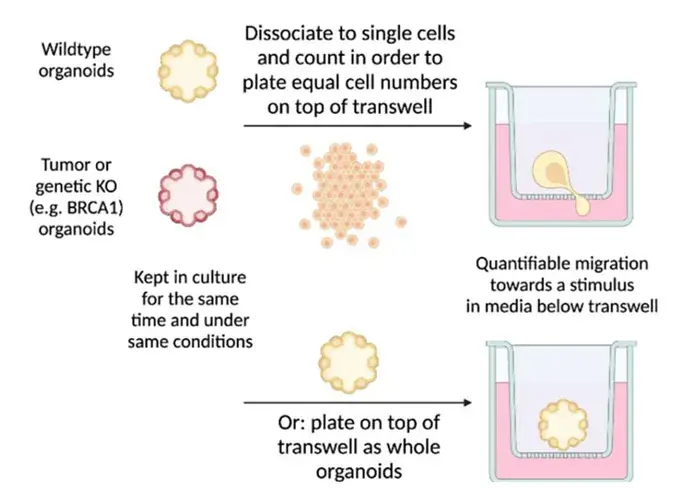
For invasion or migration questions, use a defined migration or matrix invasion assay with proper controls and distinguish movement of intact structures from movement of dissociated cells. Those formats probe different behaviors. Breast organoid methods have used Transwell-based approaches, but the assay must be matched to the hypothesis.
Choose the readout that matches the question
| Method | What it measures | Key interpretation limit |
|---|---|---|
| ATP luminescence | ATP-associated signal from the well after lysis, often used as a relative viability proxy. | Metabolic state and starting biomass can affect the signal; it does not identify which cells changed or show architecture. |
| Live/dead imaging | Spatial distribution of cells retaining live-cell dye activity and cells taking up an impermeant dye. | Dye penetration, imaging depth and segmentation need validation in 3D material. |
| LDH release | Enzyme released after loss of membrane integrity. | Reports membrane damage, not a specific death mechanism or proliferation rate. |
| EdU and Ki-67 | DNA synthesis during the EdU pulse or a proliferation-associated cell state. | Neither alone establishes net organoid growth or overall viability. |
| Time-lapse imaging | Growth, morphology and response trajectories in individual structures. | Area or diameter can change without a proportional change in viable cell number. |
| Flow cytometry | Marker-defined populations and cell-level viability after dissociation. | Disrupts 3D architecture and may recover some cell types less efficiently. |
In drug screens, an IC50 is a fitted concentration-response parameter, not a direct viability test. State the measured endpoint, exposure time, controls and fitting method. Combining a whole-well signal with imaging or a cell-death readout can help distinguish growth inhibition from cell loss. Live imaging studies show why a single ATP endpoint may miss response dynamics.
A fit-for-purpose testing plan
- Define the model and decision. Specify the tissue, source, stage, passage range and claim—for example, “retains tumor features” or “responds to a compound”.
- Set routine release checks. Include provenance, contamination testing, standardized images and growth or recovery metrics.
- Choose identity evidence. Select histology, a spatial marker panel and source comparison or authentication where applicable.
- Prespecify the functional endpoint. Choose controls, biological replicates, assay timing and quantitative acceptance criteria appropriate to the model.
- Record what changes over time. Reassess identity or function after major passage, banking or protocol changes, and before a consequential comparison.
More assays do not automatically yield stronger evidence. The strongest panel links each measurement to a stated claim and reports variability, sample source and culture conditions clearly.
Characterize the claim, not just the culture
Reliable organoid work rests on traceable culture quality, appropriate tissue identity and a function tied to the experiment. Define the evidence before interpreting a drug response or a complex 3D structure, then report the methods and limits clearly enough for another team to evaluate the conclusion.
Turn phenotype questions into measurable endpoints
Creative Bioarray offers histology services, IHC and immunofluorescence, and high-content imaging for 3D cultures. Teams planning compound studies can also explore its organoid drug screening platform. Discuss the model and endpoint to identify an appropriate workflow.
Your email address will not be published. Required fields are marked *